Start inside a flat area
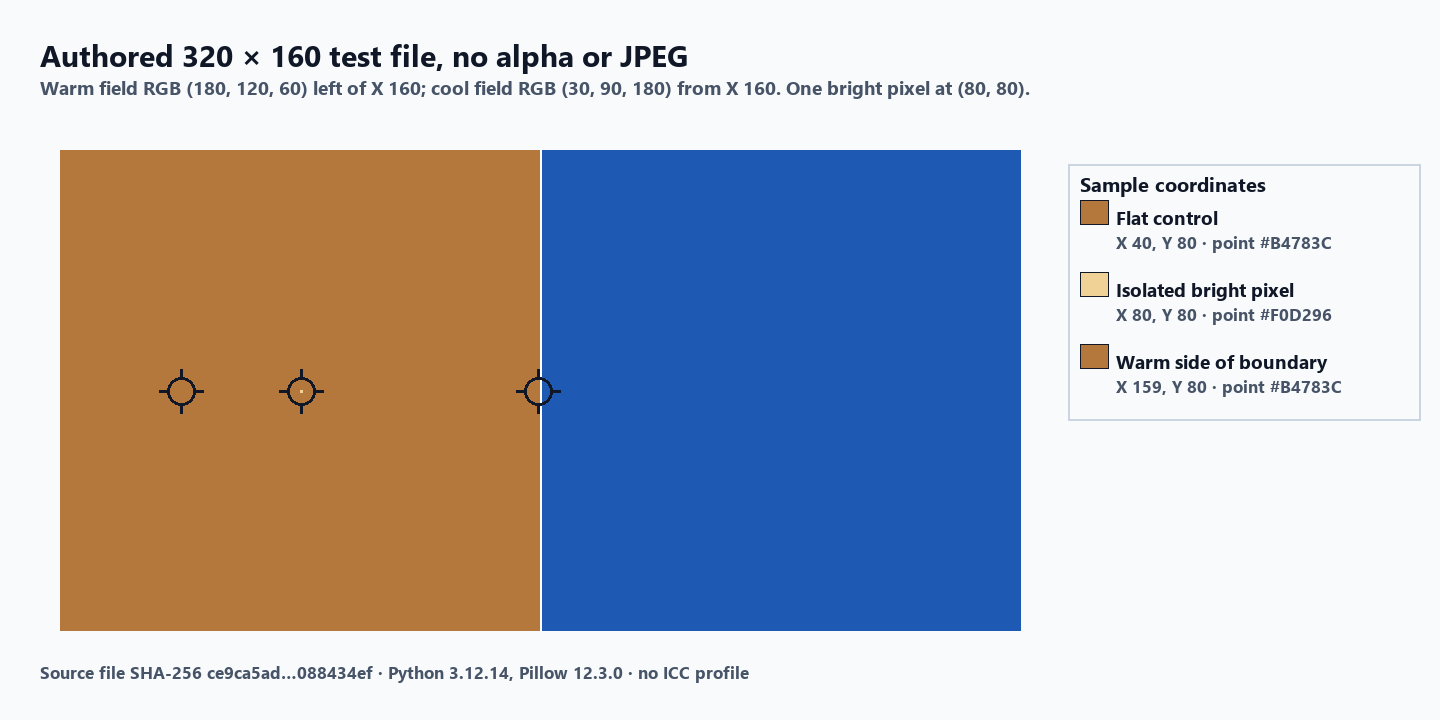
We created a 320 by 160 opaque PNG with no ICC profile, no JPEG encoding and no alpha. The left field is the warm color RGB (180, 120, 60), so a six-digit HEX of #B4783C. The right field begins at X 160 and is the cool color RGB (30, 90, 180), so #1E5AB4. One bright pixel sits at (80, 80) with RGB (240, 210, 150), or #F0D296. The full file and its SHA-256 hash are in measurements.json. The Python script, Pillow version and encoding parameters are recorded beside it.
The same coordinate gives three useful answers
We uploaded the source PNG to the existing image color picker in Chrome on Windows and clicked at the source coordinates. Every reading comes from the same decoded source pixel. The neighborhood means in this article are calculated directly from the encoded RGB bytes, not read from the picker. The picker does not offer an averaging control.
| Sample / coordinate | Point reading | 3 by 3 mean | 5 by 5 mean |
|---|---|---|---|
| Flat control / 40, 80 | #B4783C | #B4783C | #B4783C |
| Isolated bright pixel / 80, 80 | #F0D296 | #BB8246 | #B67C40 |
| Warm side of boundary / 159, 80 | #B4783C | #826E64 | #786C6C |
The flat row checks the fixture and the click. All three operations agree on the same warm value, so we know the source file matches what we authored and the picker is reading the intended pixel. The next two rows show what happens when the coordinate sits in a less forgiving place.
One bright pixel changes the point more than the neighborhood
At X 80, Y 80 the source contains a single #F0D296 pixel. The 3 by 3 window centered on it is eight warm pixels with one bright pixel in the middle. Summing the red channel gives 8 by 180 plus 240 equals 1680. Divided by 9 the mean is 186.666… which rounds half up to 187. The same arithmetic gives 130 on green and 70 on blue. The calculated 3 by 3 mean is therefore #BB8246. The 5 by 5 window holds twenty-four warm pixels and the same one bright pixel; its mean is (24 by 180 + 240) / 25 on red, with the same shape on the other channels. That returns #B67C40.
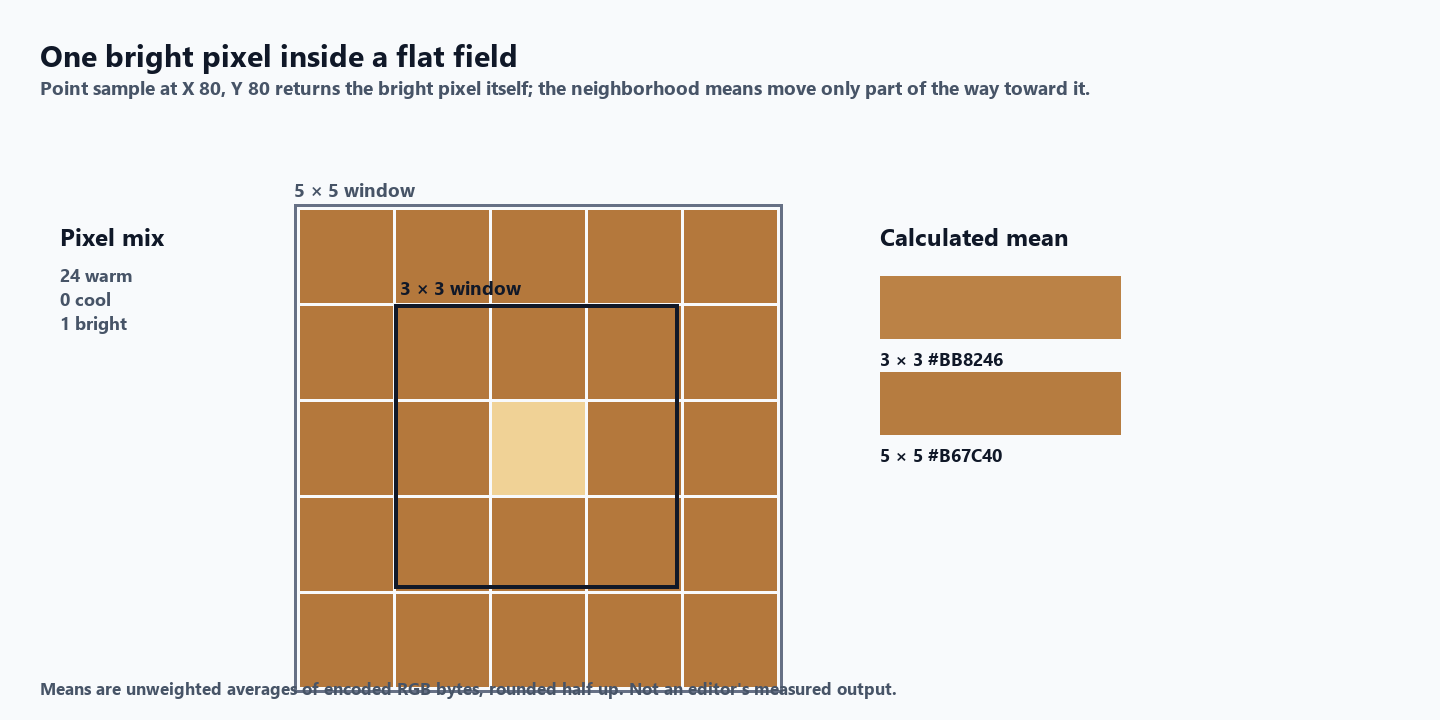
This is the case where the operation you choose actually matters. The point sample gives you the bright pixel; the 3 by 3 mean gives a value that still reads as warm; the 5 by 5 mean reads even more like the warm fill. None of the three values is wrong. They answer three different questions about the same coordinate.
An average can cross a color boundary
At X 159, Y 80 the source is still warm. The 3 by 3 window centered on it sits on six warm pixels and three cool pixels. The red channel sums to 6 by 180 plus 3 by 30 equals 1170. Divided by 9 the mean is 130. Green gives 110 and blue gives 100, so the calculated 3 by 3 mean is #826E64. The 5 by 5 window sits on fifteen warm pixels and ten cool pixels. Its red mean is 120, its green mean is 108 and its blue mean is 108. That returns #786C6C.
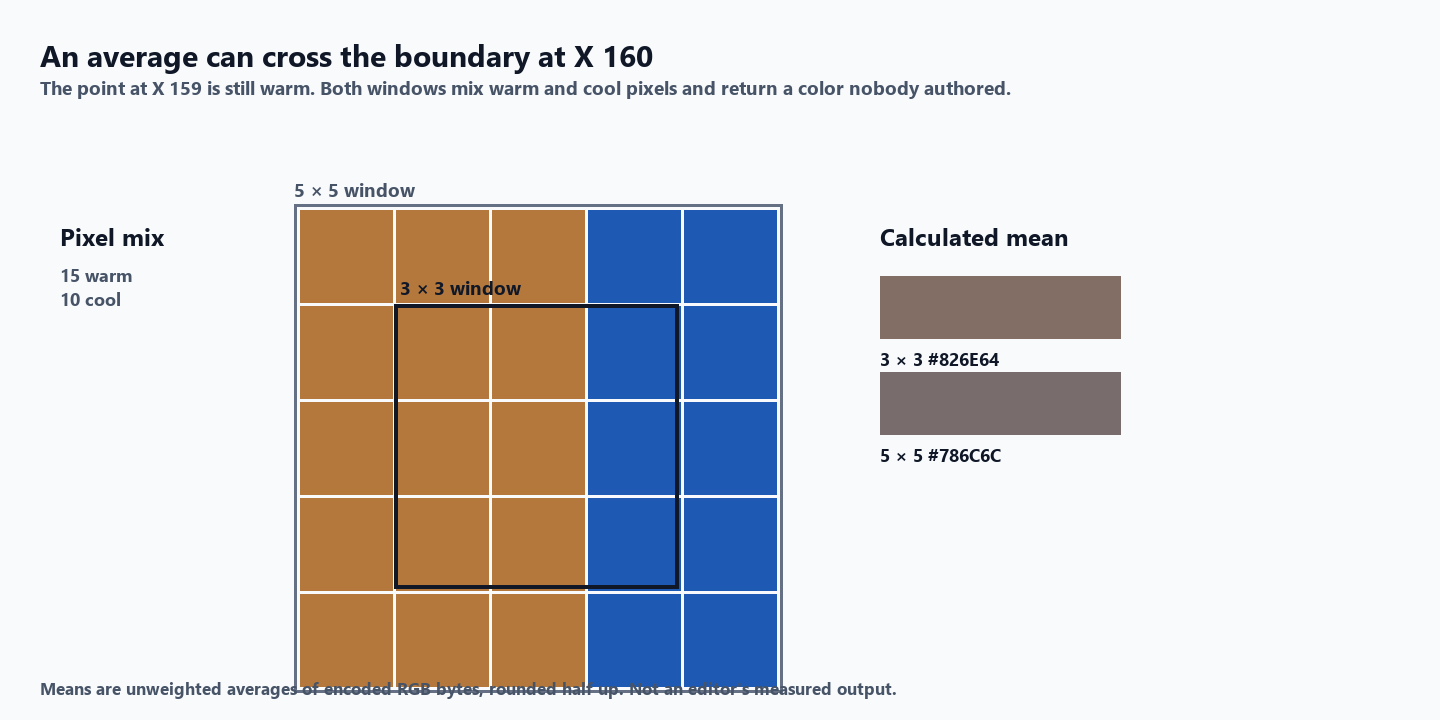
Neither #826E64 nor #786C6C is a color that exists in the source PNG. The window is mixing pixels from both sides of the boundary at X 160. If your workflow needs a single value that represents the average visible color near a boundary, this is exactly what the operation returns. If your workflow needs the color of the warm field, the point at X 159 is still warm and the average is not.
What this test does and does not check
This experiment uses one opaque test image, three coordinates and two window sizes. It does not measure Photoshop, Procreate, Roblox or any color picker that operates on a different sampling area. It does not test display calibration, ICC profiles or color management. It does not test whether the browser decodes a JPEG, an HEIC or a flattened PNG.
The general distinction between point sampling and a square average is documented by Adobe for Photoshop; see Adobe's page on foreground and background colors. Use that description for the editor behavior. The exact decoding and pixel access for HTML canvases is described on MDN's getImageData page.
Reproduce the comparison in your own browser
- Download the authored fixture. Open the image color picker and upload it.
- Click at X 40, Y 80. Record HEX and the displayed coordinates. Repeat the click and confirm you land on #B4783C.
- Click at X 80, Y 80. The point reading should be #F0D296. Use the magnifier or arrow keys to confirm the coordinate.
- Click at X 159, Y 80. The point reading should still be #B4783C. Look at the file in a viewer to confirm X 160 begins the cool field.
- Use the reproduction script if you want the same 3 by 3 and 5 by 5 means from your machine's Pillow build.

To regenerate the test image, run the script with Python 3.12 and Pillow 12.3. The original file's SHA-256 is recorded in measurements.json. If your reference panel, screen-picker tool, brand book or design spec asks for a different sampling area, follow that instruction first and use the mean only as a sanity check that the area is what you expected.
Questions about point sample vs average
Should I always use a larger sample?
No. A larger sample reduces the effect of one stray bright pixel but it can also mix the two sides of a color boundary. Pick the operation that answers the question you have.
Does a different HEX prove the tool is broken?
No. The point and the neighborhood means are intentionally measuring different inputs. First align the file, the source coordinate, the sampling area and the color space. Then decide which value answers your question.
Does PickImageColors average a neighborhood?
The current picker reads the single decoded source pixel at the selected coordinate. The magnifier helps locate that pixel. The automatic Image palette clustering is a separate operation and is not a point-average switch.
Can this diagnose a reference panel that does not respond?
No. This experiment only compares the values returned by different sampling operations. Use the editor's own documentation or a separate browser console test for that kind of failure.
Watch the experiment
Original experimental diagrams with synthetic English narration. Exact values remain in the table and downloads.