The original control
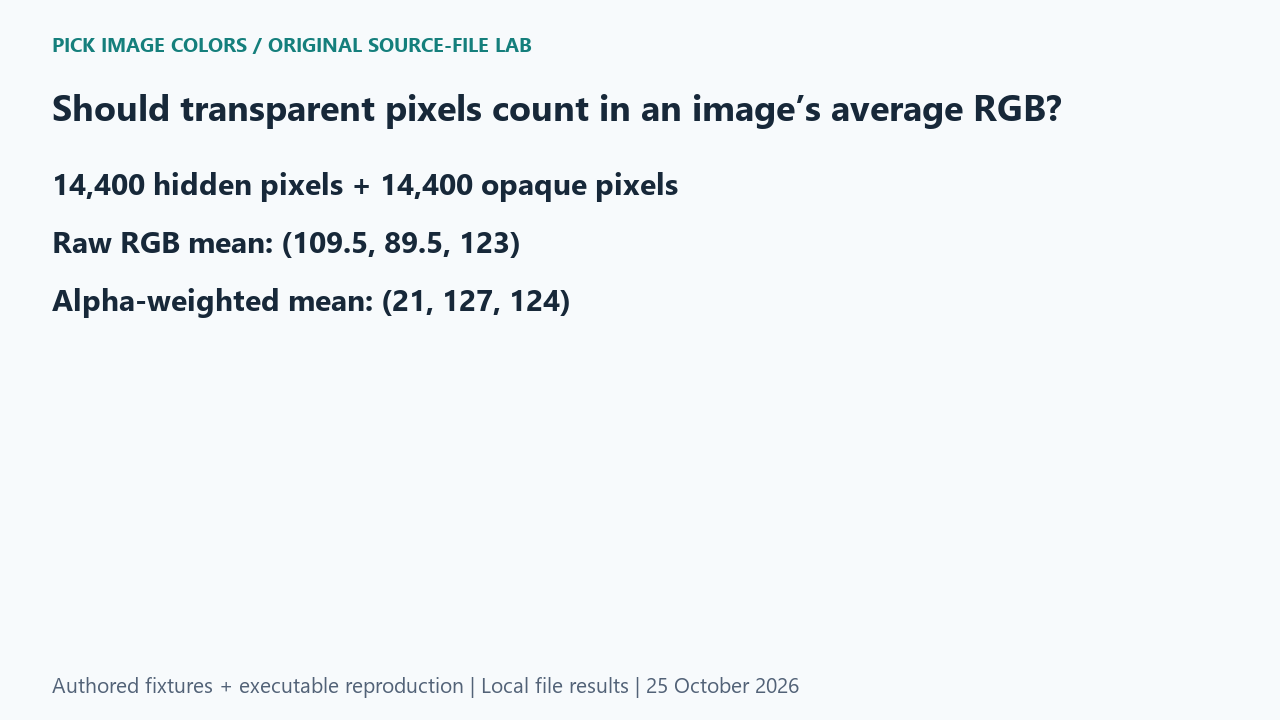
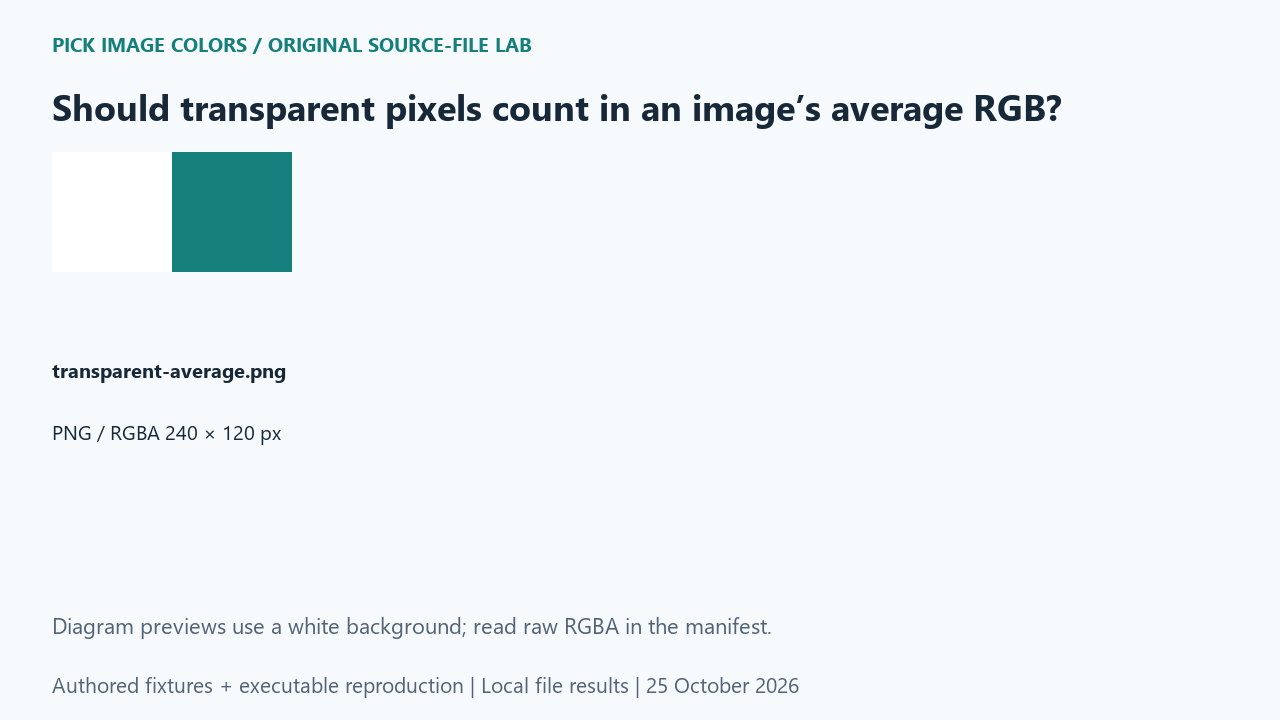
We authored a 240 × 120 RGBA fixture with two equal regions. There were 14,400 hidden pink pixels, (198, 52, 122, 0), and 14,400 opaque teal pixels, (21, 127, 124, 255). We read every stored RGBA value and computed two channel-wise arithmetic averages over the same complete grid.
What the saved files measured
The plain RGB mean was (109.5, 89.5, 123). For each channel this is (hidden value + opaque value) ÷ 2, because both regions have equal pixel counts. The alpha-weighted mean was (21, 127, 124). Its formula was sum(channel × alpha/255) ÷ sum(alpha/255); the denominator measured 14,400. Fully transparent samples contributed zero weight.
| Original test file | Detected format / mode | Dimensions | Bytes | Distinct decoded RGBA values |
|---|---|---|---|---|
| transparent-average.png | PNG / RGBA | 240 × 120 | 448 | 2 |

These are source-file measurements made with Python 3.12.14, Pillow 12.3.0 and libwebp 1.6.0. The manifest records complete file hashes, decoded RGBA hashes and the relevant coordinates. File sizes are measured bytes for these inputs, not forecasts for other images.
How to interpret this comparison
Neither number should be described simply as the one true average color. They answer different source-data questions. The raw mean includes hidden channel storage. The weighted mean excludes our alpha-zero half. An average of a composited image would additionally require a chosen background. State that choice before comparing a palette summary with a point sample or another tool.
Repeat this exact test
- Rerun the averaging case and verify both pixel counts and the alpha_weight_sum.
- Use the recorded raw_rgb_mean and alpha_weighted_mean rather than rounding them into HEX before comparing.
- For your own workflow, name whether you average stored channels, alpha-weighted channels or a composited image.
Download and unpack the ZIP. With Python and Pillow installed, run the command below. Compare the generated measurements.json with the included report. The script regenerates fixtures and computes the measurements; it does not obtain values from this article.
python reproduce.py --case alpha-weighted-image-average --out rerunScope and limits
These are arithmetic operations on stored RGB channel values. We did not linearize sRGB, calculate a perceptual mean or test an automatic palette algorithm. The formula would need an explicit policy if every pixel had zero alpha and the denominator were zero.
Our own sample is a diagnostic control. Applying its conclusion to another file requires checking that file and the operations performed on it. We have not measured a global error rate or established that an automatic palette is an exhaustive list of image colors.
Is the weighted result a prediction of every palette generator?
No. It is the specified formula applied to our known fixture. A palette generator may use a different sampling or clustering procedure.
Watch the source-file comparison
Original diagrams and synthetic English narration. Caption sentence timings are approximate.